Gabriel Brammer
(This page is auto-generated from the Jupyter notebook nirspec-data-products.ipynb.)
Here we summarize the files available for the DJA reductions of the public NIRSpec MSA datasets.
The full interactive table can be found here and with an associated CSV catalog nirspec_graded_v0.ecsv.
%matplotlib inline
import os
import warnings
warnings.filterwarnings('ignore')

import numpy as np
import matplotlib.pyplot as plt
import scipy.ndimage as nd

import astropy.io.fits as pyfits
import astropy.units as u

import sep

import grizli
from grizli import utils
print(f'grizli version: {grizli.__version__}')

import msaexp
import msaexp.spectrum
print(f'msaexp version: {msaexp.__version__}')

BASE_URL = 'https://s3.amazonaws.com/msaexp-nirspec/extractions/'
PATH_TO_FILE = BASE_URL + '{root}/{file}'
grizli version: 1.10.dev3+g341a999
msaexp version: 0.6.12.dev5+ge335c82.d20230530
Full summary catalog
grade based on visual inspection of individual spectra. That is, a particular object can have multiple entries in the table and only grade=3 for the grating+filter combination that showed robust features.
- 3 = Robust
- 2 = Perhaps line or continuum features, but ambiguous redshift
- 1 = No features
- 0 = DQ problem
nrs = utils.read_catalog(BASE_URL + 'nirspec_graded_v0.ecsv', format='ascii.ecsv')
print('# Grade')
un = utils.Unique(nrs['grade'])
# Grade
   N  value
====  ==========
 381           0
 624           2
1810           3
2309           1
# By grating
grat = utils.Unique(nrs['grating'])
   N  value
====  ==========
 176  G235H
 179  G140H
 331  G395H
 574  G395M
 598  G140M
 607  G235M
2659  PRISM
# By project
root = utils.Unique(nrs['root'])
   N  value
====  ==========
  69  macsj0647-single-v1
 101  smacs0723-ero-v1
 111  abell2744-ddt-v1
 117  snH0pe-v1
 132  macsj0647-v1
 143  rxj2129-ddt-v1
 154  gds-deep-hr-v1
 182  goodsn-wide-v1
 266  ceers-ddt-v1
 294  gds-deep-lr-v1
 405  whl0137-v1
 532  abell2744-glass-v1
 654  gds-deep-mr-v1
 906  ceers-mr-v1
1058  ceers-lr-v1
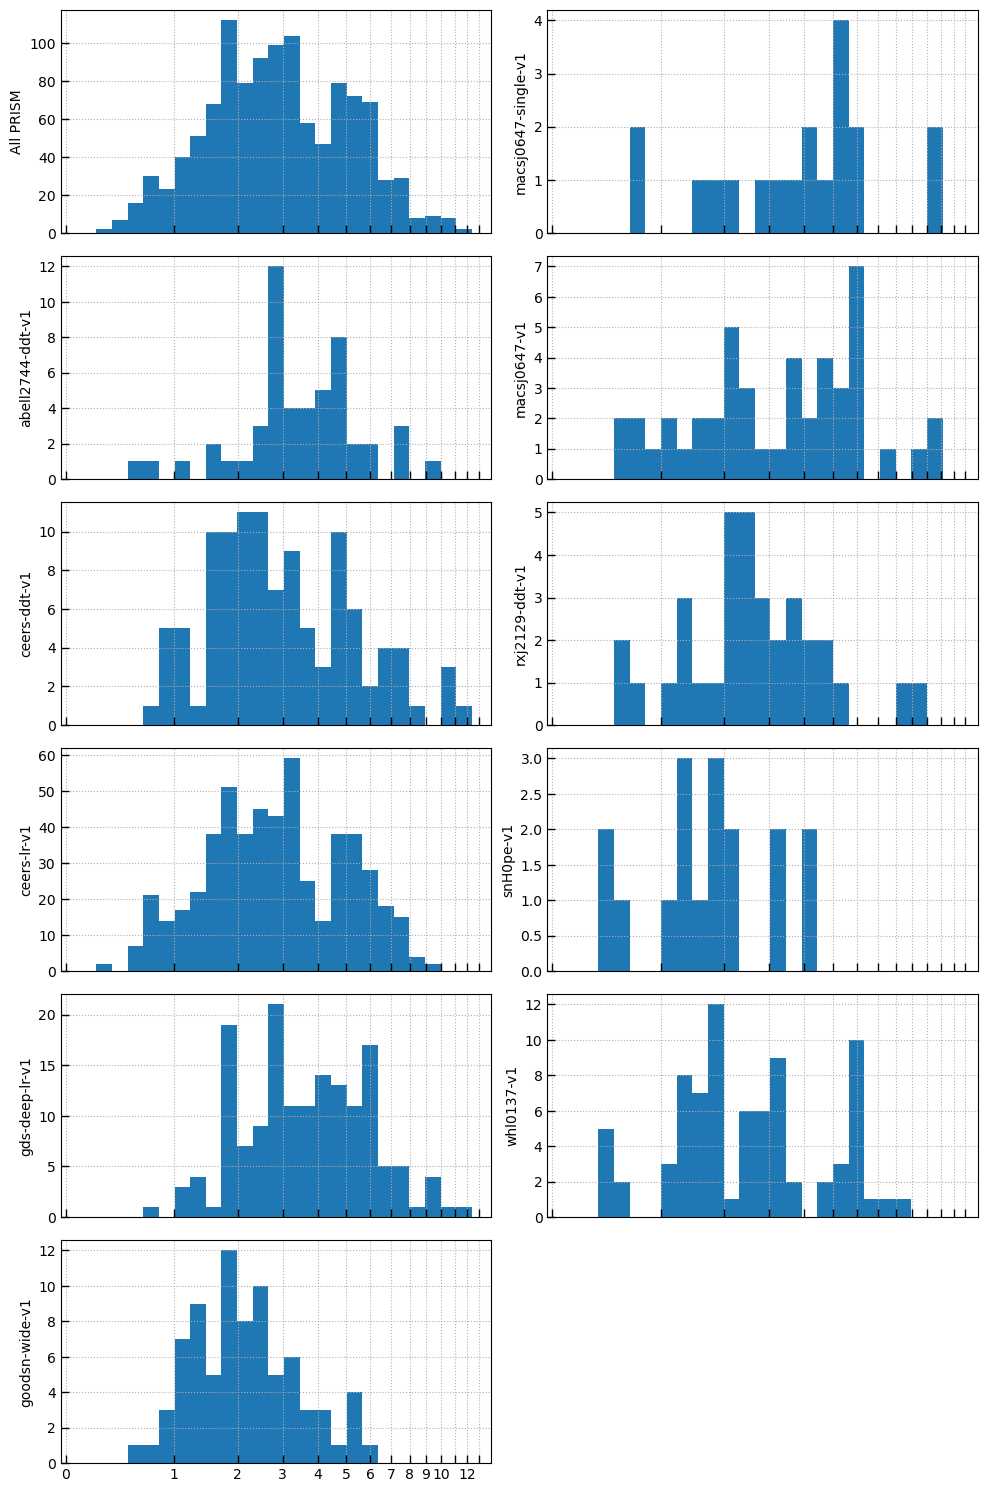
# Robust redshifts
robust_prism = (nrs['grating'] == 'PRISM') & (nrs['grade'] == 3)

roots = utils.Unique(nrs['root'][robust_prism], verbose=False)

nx = 2
ny = int(np.ceil((len(roots) + 1) / 2))

sx = 2.5

fig, axes = plt.subplots(ny,nx,sharex=True, sharey=False, figsize=(nx*sx*2, ny*sx))

lnz = np.log(1+nrs['z'])

bins = utils.log_zgrid([0.1, 13], 0.1)

xtv = [0,1,2,3,4,5,6,7,8,9,10,11,12,13]
xtl = [0,1,2,3,4,5,6,7,8,9,10,'',12,'']

_ = axes[0][0].hist(lnz[robust_prism], bins=np.log(1+bins))
axes[0][0].set_ylabel('All PRISM')
axes[0][0].grid()

count = 0

for root in roots.values:
    count += 1
    i = count // ny
    j = count - ny*i

    _ = axes[j][i].hist(lnz[robust_prism][roots[root]], bins=np.log(1+bins))
    axes[j][i].set_ylabel(root)
    axes[j][i].grid()

axes[j][i].set_xticks(np.log(1+np.array(xtv)))
axes[j][i].set_xticklabels(xtl)

for last in range(count*1, nx*ny-1):
    count += 1
    i = count // ny
    j = count - ny*i

    _ = axes[j][i].axis('off')

_ = fig.tight_layout(pad=1)
Look at a source from JADES-DEEP
# id = '58975' # remarkable z=9
# ymax = [1, 0.2, 0.7, 0.7]
# xlimits = [(0.5, 5.4), (0.5, 2.2), (3.9, 4.6), (5.0, 5.3)]

# id = '35180' # bright z=1.8
# ymax = [2]*4

id = '15157' # z=4.1
ymax = [0.8, 0.4, 0.8, 0.8]
xlimits = [(0.5, 5.4), (0.5, 2.2), (2.2, 2.8), (3.18, 3.6)]
is_gds = np.array([f.startswith('gds-deep') for f in nrs['file']])

src = np.array([id in f for f in nrs['file']]) & is_gds

nrs['root','file','grating','filter','z','grade'][src]

urls = [PATH_TO_FILE.format(**row) for row in nrs[src]]

z = np.mean(nrs['z'][src & (nrs['grade'] == 3)])

nrs[src]['root','file','grating','filter','z','grade']
| root | file | grating | filter | z | grade |
|---|---|---|---|---|---|
| str19 | str53 | str5 | str6 | float64 | int64 |
| gds-deep-hr-v1 | gds-deep-hr-v1_g395h-f290lp_1210_15157.spec.fits | G395H | F290LP | 4.1486 | 3 |
| gds-deep-lr-v1 | gds-deep-lr-v1_prism-clear_1210_15157.spec.fits | PRISM | CLEAR | 4.1499 | 3 |
| gds-deep-mr-v1 | gds-deep-mr-v1_g140m-f070lp_1210_15157.spec.fits | G140M | F070LP | 4.2156 | 1 |
| gds-deep-mr-v1 | gds-deep-mr-v1_g235m-f170lp_1210_15157.spec.fits | G235M | F170LP | 4.1482 | 3 |
| gds-deep-mr-v1 | gds-deep-mr-v1_g395m-f290lp_1210_15157.spec.fits | G395M | F290LP | 4.1482 | 3 |
Slitlet viewer
URLs like:
2D spectra
for u in urls:
    if 'prism' in u:
        break

print(f'Load 2D file: {u}')

img = pyfits.open(u)
spec = utils.GTable(img['SPEC1D'].data)
img.info()
Load 2D file: https://s3.amazonaws.com/msaexp-nirspec/extractions/gds-deep-lr-v1/gds-deep-lr-v1_prism-clear_1210_15157.spec.fits
Filename: /Users/gbrammer/.astropy/cache/download/url/8f02d3866629baee18593ec239973c9c/contents
No.    Name      Ver    Type      Cards   Dimensions   Format
  0  PRIMARY       1 PrimaryHDU       4   ()
  1  SPEC1D        1 BinTableHDU   1504   435R x 3C   ['D', 'D', 'D']
  2  SCI           1 ImageHDU      1494   (435, 41)   float32
  3  WHT           1 ImageHDU      1494   (435, 41)   float32
  4  PROFILE       1 ImageHDU      1494   (435, 41)   float64
  5  PROF1D        1 BinTableHDU     25   41R x 3C   [D, E, D]
# Metadata and exposure data
for i, k in enumerate(img['SCI'].header):
    print(f"{k} : {img['SCI'].header[k]}")
    if k == 'FILE2':
        break

print('...')
XTENSION : IMAGE
BITPIX : -32
NAXIS : 2
NAXIS1 : 435
NAXIS2 : 41
PCOUNT : 0
GCOUNT : 1
CRPIX1 : 218
CRPIX2 : 21
CRPIX3 : 1
CRVAL1 : 34478.17210692866
CRVAL2 : 53.11342711704571
CRVAL3 : -27.80296418104931
CD1_1 : 112.0143042734245
CD2_2 : -2.5018683716805e-05
CD3_2 : 4.3106889543069e-06
CD2_3 : 1.0
CD3_3 : 1.0
CTYPE1 : WAVELEN
CTYPE2 : RA---TAN
CTYPE3 : DEC--TAN
CUNIT1 : Angstrom
CUNIT2 : deg
CUNIT3 : deg
RADESYS : ICRS
WCSNAME : SLITWCS
SLIT_PA : 99.77600798539926
PSCALE : 0.09145217434882043
SLIT_Y0 : 0.1046029202771379
SLIT_DY : -0.2
LMIN : 5.336618171269953
DLAM : 0.01120143042734245
BKGOFF : 6
OTHRESH : 30
WSAMPLE : 1.05
LOGWAVE : False
BUNIT : mJy
GRATING : PRISM
FILTER : CLEAR
NFILES : 36
EFFEXPTM : 99788.00399999997
SRCNAME : 1210_15157
SRCID : 15157
SRCRA : 53.113326
SRCDEC : -27.80299179999997
FILE1 : jw01210001001_11101_00001_nrs1_phot.247.1210_15157.fits
CALVER1 : 1.9.4
CRDS1 : jwst_1084.pmap
GRAT1 : PRISM
FILTER1 : CLEAR
MSAMET1 : jw01210001001_02_msa.fits
MSAID1 : 117
MSACNF1 : 2
SLITID1 : 247
SRCNAM1 : 1210_15157
SRCID1 : 15157
SRCRA1 : 53.113326
SRCDEC1 : -27.80299179999997
PIXSR1 : 4.83547881464665e-13
TOUJY1 : 0.483547881464665
DETECT1 : NRS1
XSTART1 : 1323
XSIZE1 : 425
YSTART1 : 233
YSIZE1 : 20
RA_REF1 : 53.1410916104911
DE_REF1 : -27.79159354885499
RL_REF1 : -38.97457220320062
V2_REF1 : 378.563202
V3_REF1 : -428.402832
V3YANG1 : 138.5745697
RA_V11 : 52.96411558412523
DEC_V11 : -27.76510758004405
PA_V31 : 321.1077987432105
EXPSTR1 : 59873.16264294121
EXPEND1 : 59873.16264294121
EFFEXP1 : 2771.889
DITHN1 : 1
DITHX1 : 7.646252570500947
DITHY1 : 29.2702219123212
DITHT1 : 3-SHUTTER-SLITLET
NFRAM1 : 5
NGRP1 : 19
NINTS1 : 2
RDPAT1 : NRSIRS2
FILE2 : jw01210001001_11101_00002_nrs1_phot.247.1210_15157.fits
...
fig, axes = plt.subplots(3,1, figsize=(8, 5), sharex=True, sharey=True)

msk = img['WHT'].data > 0

for i, k in enumerate(['SCI','WHT','PROFILE']):
    _data = img[k].data
    vm = np.percentile(_data[msk], [2,99])
    ax = axes[i]
    ax.imshow(_data, vmin=vm[0], vmax=vm[1], cmap='plasma_r', aspect='auto')
    ax.set_ylabel(k)
    ax.set_yticklabels([])

xtv = [1,2,3,4,5]
xti = np.interp(xtv, spec['wave'], np.arange(len(spec)))

a2 = axes[0].twiny()
a2.set_xlabel('pix')
a2.set_xlim(0, _data.shape[1])

ax.set_xticks(xti)
ax.set_xticklabels(xtv)

ax.set_xlabel(r'$\lambda_\mathrm{obs}\,[\mu\mathrm{m}]$')

_ = fig.tight_layout(pad=1)
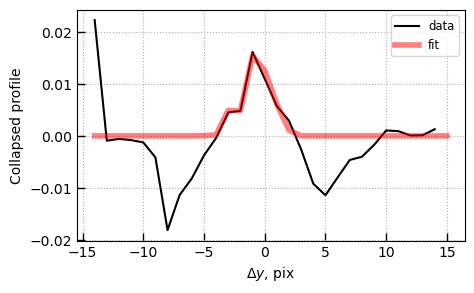
Optimal extraction profile
The 1D spectrum is created with an “optimal” (Horne 1986) extraction where the profile was fit to the observed spectrum both in terms of the center and wavelength-dependent width.
# Collapsed 1D profile
p1 = utils.GTable(img['PROF1D'].data)

fig, ax = plt.subplots(1,1,figsize=(5,3))
ax.plot(p1['pix'], p1['profile'], label='data', color='k')
ax.plot(p1['pix'], p1['pfit'], label='fit', color='r', lw=4, alpha=0.5)

ax.set_xlabel(r'$\Delta y$, pix')
ax.set_ylabel('Collapsed profile')
ax.legend()

ax.grid()
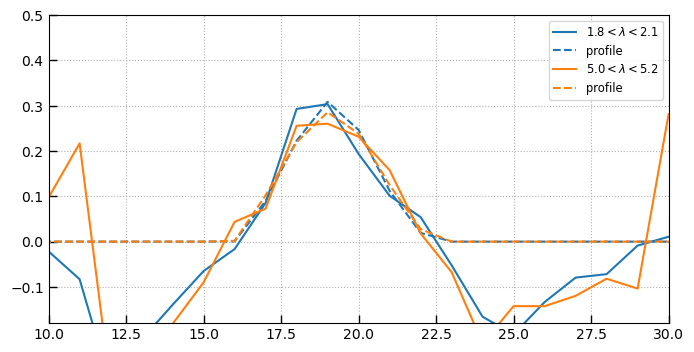
wlims = [(1.8, 2.1), (5, 5.2)]
fig, ax = plt.subplots(1, 1, figsize=(8, 4), sharex=True)

w2d = np.ones(img['SCI'].data.shape)*spec['wave']

for i, wlim in enumerate(wlims):
    msk = (w2d > wlim[0]) & (w2d < wlim[1]) & (img['WHT'].data > 0)
    ydata = (img['SCI'].data*msk).sum(axis=1)
    pdata = (img['PROFILE'].data*msk).sum(axis=1)

    anorm = (ydata*pdata).sum()/(pdata**2).sum()
    pdata *= anorm
    norm = pdata.sum()

    pl = ax.plot(ydata/norm, label=r'$xx < \lambda < yy$'.replace('xx', f'{wlim[0]:.1f}').replace('yy', f'{wlim[1]:.1f}'))
    ax.plot(pdata/norm, label='profile', color=pl[0].get_color(), linestyle='--')

ax.set_ylim(-0.18, 0.5)
ax.legend()
ax.set_xlim(10,30)
ax.grid()
1D spectra
Some tools in msaexp.spectrum.SpectrumSampler for interacting with 1D spectra.
# Open the files into 1D objects, directly from the web
sobj = {}
for u in urls:
    print(f'Read {u}')
    key = os.path.basename(u)
    sobj[key] = msaexp.spectrum.SpectrumSampler(u)
Read https://s3.amazonaws.com/msaexp-nirspec/extractions/gds-deep-hr-v1/gds-deep-hr-v1_g395h-f290lp_1210_15157.spec.fits
Read https://s3.amazonaws.com/msaexp-nirspec/extractions/gds-deep-lr-v1/gds-deep-lr-v1_prism-clear_1210_15157.spec.fits
Read https://s3.amazonaws.com/msaexp-nirspec/extractions/gds-deep-mr-v1/gds-deep-mr-v1_g140m-f070lp_1210_15157.spec.fits
Read https://s3.amazonaws.com/msaexp-nirspec/extractions/gds-deep-mr-v1/gds-deep-mr-v1_g235m-f170lp_1210_15157.spec.fits
Read https://s3.amazonaws.com/msaexp-nirspec/extractions/gds-deep-mr-v1/gds-deep-mr-v1_g395m-f290lp_1210_15157.spec.fits
# A single (prism) spectrum

for i, k in enumerate(sobj):
    if 'prism' in k:
        break

sp = sobj[k]
sp.spec.info()
<GTable length=435>
  name    dtype  unit
-------- ------- ----
    wave float64
    flux float64
     err float64
    corr float64
  escale float64
full_err float64  uJy
   valid    bool
       R float64
 to_flam float64
# Metadata about the 1D extraction
for i, k in enumerate(sp.spec.meta):
    print(f"{k} : {sp.spec.meta[k]}")
    if k == 'CRDS2':
        break

print('...')
VERSION : 0.6.12.dev18+gc61a335
TOMUJY : 1.0
PROFCEN : -0.9085424632954114
PROFSIG : 1.263439656446174
PROFSTRT : 0
PROFSTOP : 435
YTRACE : 20.0
EXTNAME : SPEC1D
CRPIX1 : 218
CRPIX2 : 21
CRPIX3 : 1
CRVAL1 : 34478.17210692866
CRVAL2 : 53.11342711704571
CRVAL3 : -27.80296418104931
CD1_1 : 112.0143042734245
CD2_2 : -2.5018683716805e-05
CD3_2 : 4.3106889543069e-06
CD2_3 : 1.0
CD3_3 : 1.0
CTYPE1 : WAVELEN
CTYPE2 : RA---TAN
CTYPE3 : DEC--TAN
CUNIT1 : Angstrom
CUNIT2 : deg
CUNIT3 : deg
RADESYS : ICRS
WCSNAME : SLITWCS
SLIT_PA : 99.77600798539926
PSCALE : 0.09145217434882043
SLIT_Y0 : 0.1046029202771379
SLIT_DY : -0.2
LMIN : 5.336618171269953
DLAM : 0.01120143042734245
BKGOFF : 6
OTHRESH : 30
WSAMPLE : 1.05
LOGWAVE : False
BUNIT : mJy
GRATING : PRISM
FILTER : CLEAR
NFILES : 36
EFFEXPTM : 99788.00399999997
SRCNAME : 1210_15157
SRCID : 15157
SRCRA : 53.113326
SRCDEC : -27.80299179999997
FILE1 : jw01210001001_11101_00001_nrs1_phot.247.1210_15157.fits
CALVER1 : 1.9.4
CRDS1 : jwst_1084.pmap
GRAT1 : PRISM
FILTER1 : CLEAR
MSAMET1 : jw01210001001_02_msa.fits
MSAID1 : 117
MSACNF1 : 2
SLITID1 : 247
SRCNAM1 : 1210_15157
SRCID1 : 15157
SRCRA1 : 53.113326
SRCDEC1 : -27.80299179999997
PIXSR1 : 4.83547881464665e-13
TOUJY1 : 0.483547881464665
DETECT1 : NRS1
XSTART1 : 1323
XSIZE1 : 425
YSTART1 : 233
YSIZE1 : 20
RA_REF1 : 53.1410916104911
DE_REF1 : -27.79159354885499
RL_REF1 : -38.97457220320062
V2_REF1 : 378.563202
V3_REF1 : -428.402832
V3YANG1 : 138.5745697
RA_V11 : 52.96411558412523
DEC_V11 : -27.76510758004405
PA_V31 : 321.1077987432105
EXPSTR1 : 59873.16264294121
EXPEND1 : 59873.16264294121
EFFEXP1 : 2771.889
DITHN1 : 1
DITHX1 : 7.646252570500947
DITHY1 : 29.2702219123212
DITHT1 : 3-SHUTTER-SLITLET
NFRAM1 : 5
NGRP1 : 19
NINTS1 : 2
RDPAT1 : NRSIRS2
FILE2 : jw01210001001_11101_00002_nrs1_phot.247.1210_15157.fits
CALVER2 : 1.9.4
CRDS2 : jwst_1084.pmap
...
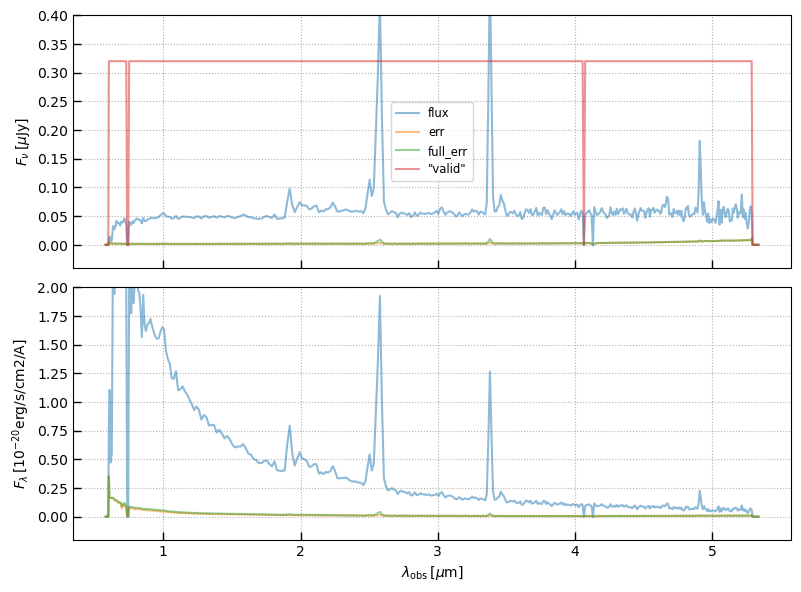
fig, axes = plt.subplots(2,1,figsize=(8,6), sharex=True)
ax = axes[0]

for c in ['flux','err','full_err']:
    ax.plot(sp.spec_wobs, sp.spec[c], alpha=0.5, label=c)
#ax.plot(sp.spec_wobs, sp.spec['err'], alpha=0.5, label='err')
#ax.plot(sp.spec_wobs, sp.spec['full_err'], alpha=0.5, label='full_err')

ax.set_ylim(-0.1*ymax[1], ymax[1])
ax.plot(sp.spec_wobs, sp.valid*ymax[1]*0.8, alpha=0.5, label='"valid"')
ax.grid()
ax.legend()
ax.set_ylabel(r'$F_\nu\,[\mu\mathrm{Jy}]$')

ax = axes[1]
for c in ['flux','err','full_err']:
    ax.plot(sp.spec_wobs, sp.spec[c]*sp.spec['to_flam'], alpha=0.5, label=c)

ax.set_ylim(-0.1*ymax[1]*5, ymax[1]*5)
ax.set_ylabel(r'$F_\lambda\,[10^{-20}\mathrm{erg/s/cm2/A}]$')
ax.grid()

ax.set_xlabel(r'$\lambda_\mathrm{obs}\,[\mu\mathrm{m}]$')

_ = fig.tight_layout(pad=1)
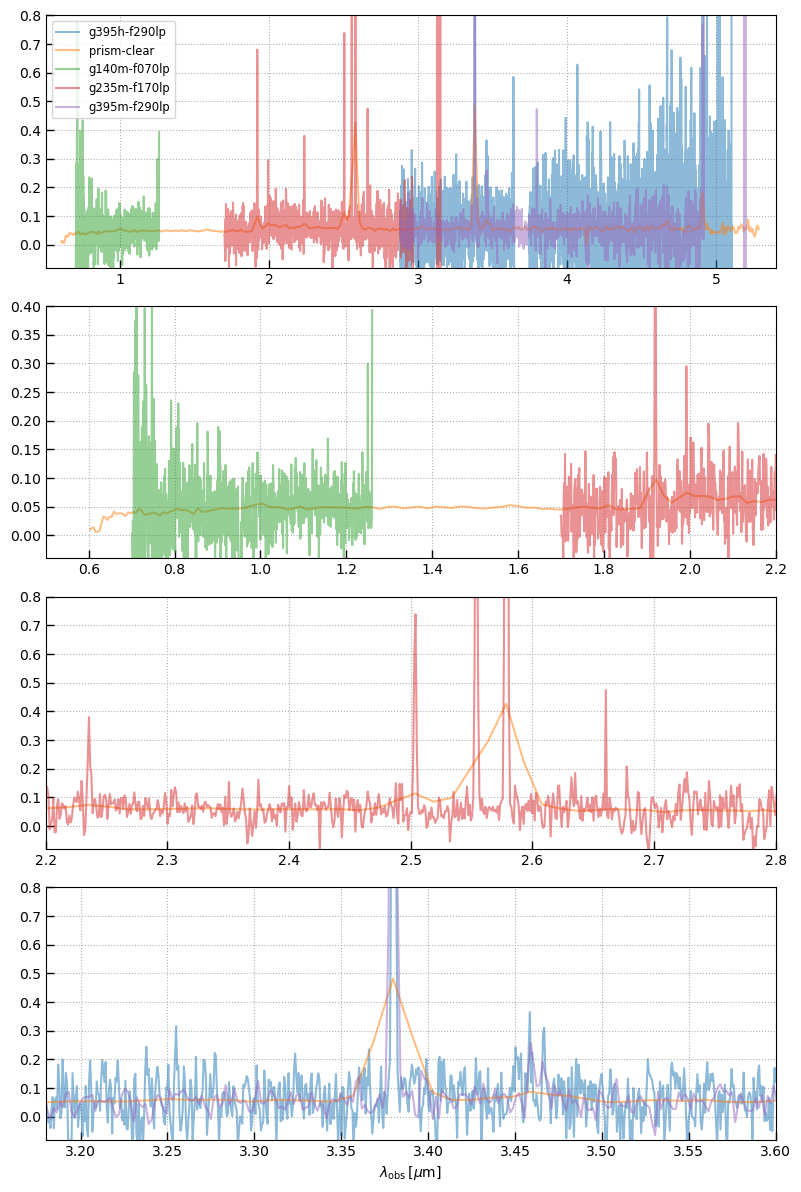
# Show all spectra
fig, axes = plt.subplots(len(xlimits),1,figsize=(8,3*len(xlimits)))

for ax, xlim, ym in zip(axes, xlimits, ymax):
    for i, k in enumerate(sobj):
        sp = sobj[k]
        ax.plot(sp.spec_wobs[sp.valid], sp.spec['flux'][sp.valid], alpha=0.5, label=k.split('_')[1])

    ax.set_xlim(*xlim)

    ax.set_ylim(-0.1*ym, ym)
    ax.grid()

axes[0].legend()
ax.set_xlabel(r'$\lambda_\mathrm{obs}\,[\mu\mathrm{m}]$')

_ = fig.tight_layout(pad=1)
Spectral resolution
sp.spec.info()
<GTable length=1414>
  name    dtype  unit
-------- ------- ----
    wave float64
    flux float64
     err float64
    corr float64
  escale float64
full_err float64  uJy
   valid    bool
       R float64
 to_flam float64
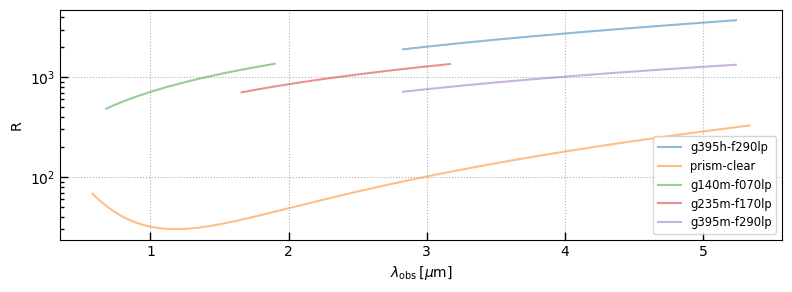
fig, ax = plt.subplots(1,1,figsize=(8,3))

for i, k in enumerate(sobj):
    sp = sobj[k]
    ax.plot(sp.spec_wobs, sp.spec['R'], alpha=0.5, label=k.split('_')[1])

ax.legend()
ax.set_ylabel('R')
ax.grid()
ax.semilogy()

ax.set_xlabel(r'$\lambda_\mathrm{obs}\,[\mu\mathrm{m}]$')

_ = fig.tight_layout(pad=1)
lw, lr = utils.get_line_wavelengths()

bspl = sp.bspline_array(nspline=21)
bspl.shape

lines = ['Ha','SII-6717','SII-6731']
line_waves = []
for l in lines:
    line_waves += lw[l]
line_um = lw['Ha'][0]*(1+z)/1.e4
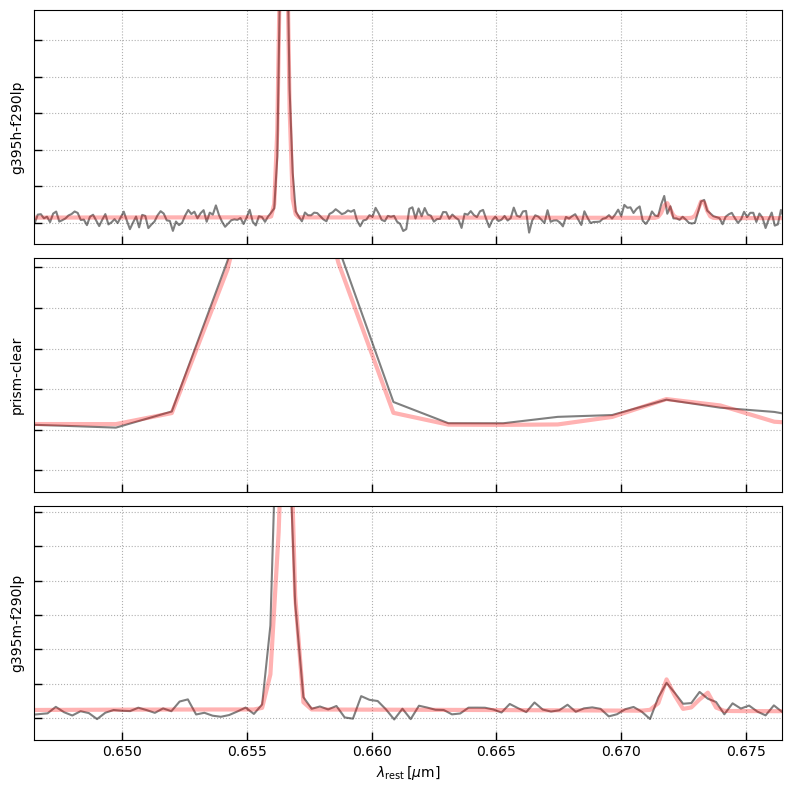
fig, axes = plt.subplots(3,1,figsize=(8,8), sharex=True, sharey=False)
counter = 0
for i, k in enumerate(sobj):
sp = sobj[k]
if sp.spec_wobs.max() < 3.3:
continue
ax = axes[counter]
ax.plot(sp.spec_wobs[sp.valid]/(1+z), sp.spec['flux'][sp.valid], alpha=0.5, label=k.split('_')[1], color='k')
ax.set_yticklabels([])
ax.set_ylabel(k.split('_')[1])
### Full line fit
# Dummy spline continuum
bspl = sp.bspline_array(nspline=21)
# Generate emission line templates accounting for spectral resolution
line_in_grating = []
for lwi in line_waves:
line_in_grating.append(sp.emission_line(lwi*(1+z)/1.e4,
line_flux=1,
scale_disp=1.3, velocity_sigma=50))
A = np.vstack([bspl, line_in_grating])
Ax = A/sp.spec['full_err']
yx = sp.spec['flux']/sp.spec['full_err']
lsq = np.linalg.lstsq(Ax[:,sp.valid].T, yx[sp.valid])
model = A.T.dot(lsq[0])
ax.plot(sp.spec_wobs/(1+z), model, color='r', lw=3, alpha=0.3)
lwi = np.abs(sp.spec_wobs - line_um) < 0.1
ym = model[lwi].max()*0.5
ax.set_ylim(-0.1*ym, ym)
ax.grid()
counter += 1
ax.set_xlim(line_um/(1+z)-0.01, line_um/(1+z)+0.02)
ax.set_xlabel(r'$\lambda_\mathrm{rest}\,[\mu\mathrm{m}]$')
_ = fig.tight_layout(pad=1)
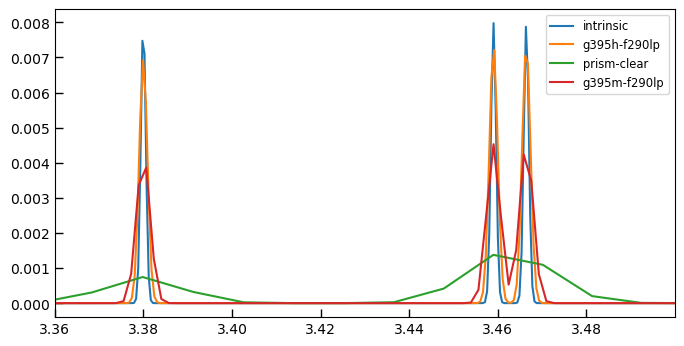
Smooth a full template
Generate a template here, but can also be, e.g. a FSPS or bagpipes model
import eazy.templates

wtempl = np.logspace(3, 4, 4096*4)
ftempl = wtempl*0.

for w in line_waves:
    dv = (wtempl-w)/w*3.e5
    vwidth = 50
    ftempl += 1/np.sqrt(2*np.pi*vwidth**2) * np.exp(-dv**2/2/vwidth**2)

templ = eazy.templates.Template(arrays=(wtempl, ftempl*1.e11))
# Now fold it through the spectrum dispersion

fig, ax = plt.subplots(1,1,figsize=(8,4), sharex=True, sharey=False)

counter = 0

ax.plot(wtempl*(1+z)/1.e4, ftempl, label='intrinsic')

for i, k in enumerate(sobj):
    sp = sobj[k]
    if sp.spec_wobs.max() < 3.3:
        continue

    resamp = sp.resample_eazy_template(templ, z=z, scale_disp=1.3, velocity_sigma=50)
    ax.plot(sp.spec_wobs, resamp, label=k.split('_')[1])

ax.legend()
ax.set_xlim(line_um-0.02, line_um+0.12)
(3.3599737502612492, 3.4999737502612494)
# Profile the resample function
%timeit resamp = sp.resample_eazy_template(templ, z=z, scale_disp=1.3, velocity_sigma=50)
906 µs ± 9.98 µs per loop (mean ± std. dev. of 7 runs, 1,000 loops each)
Full fitting functions
These are the msaexp functions that were used to fit the reshifts and line fluxes in the full catalog.
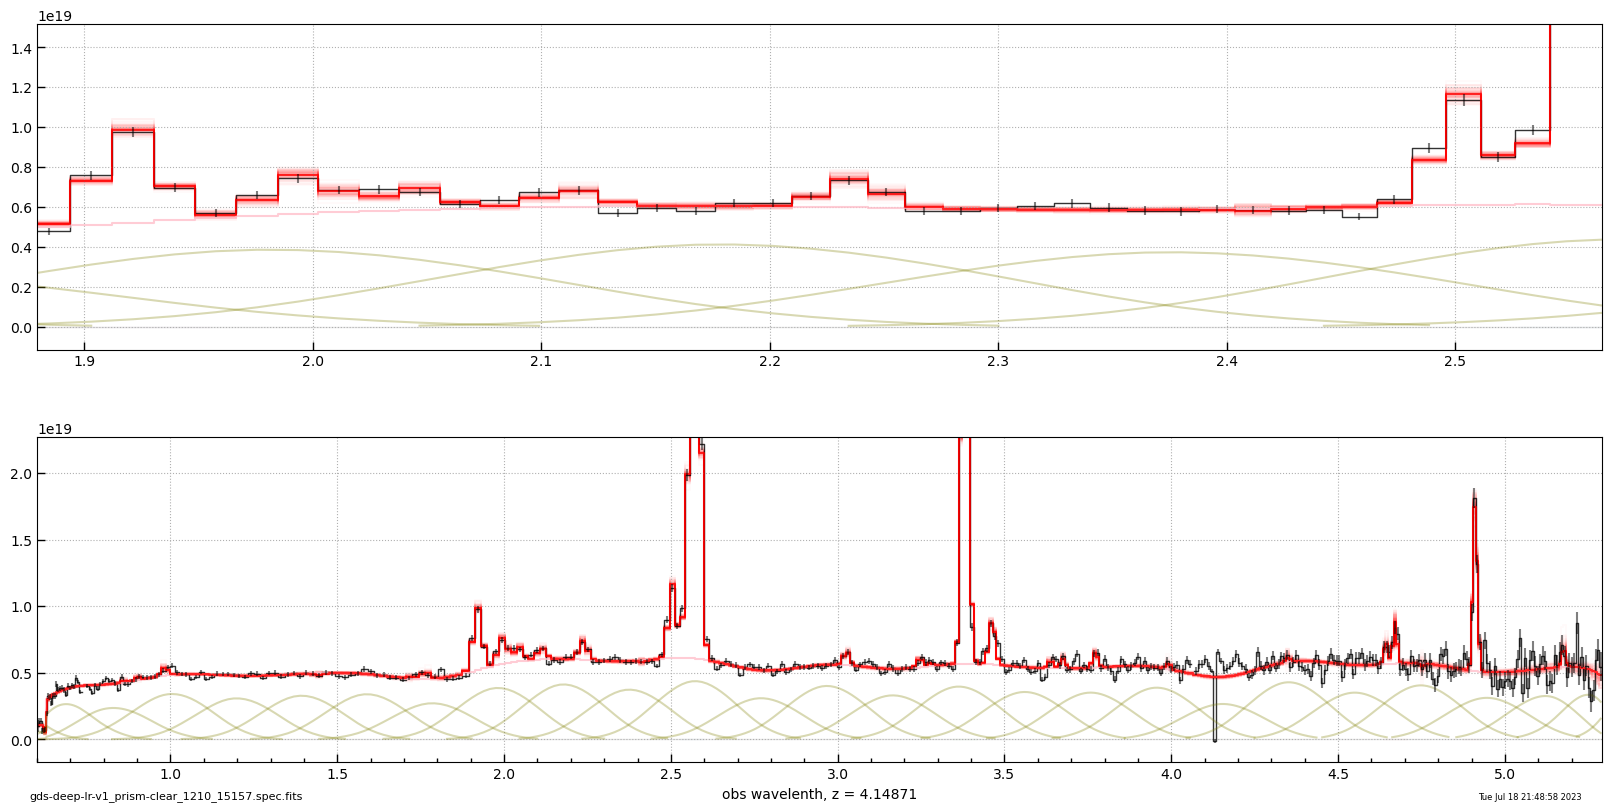
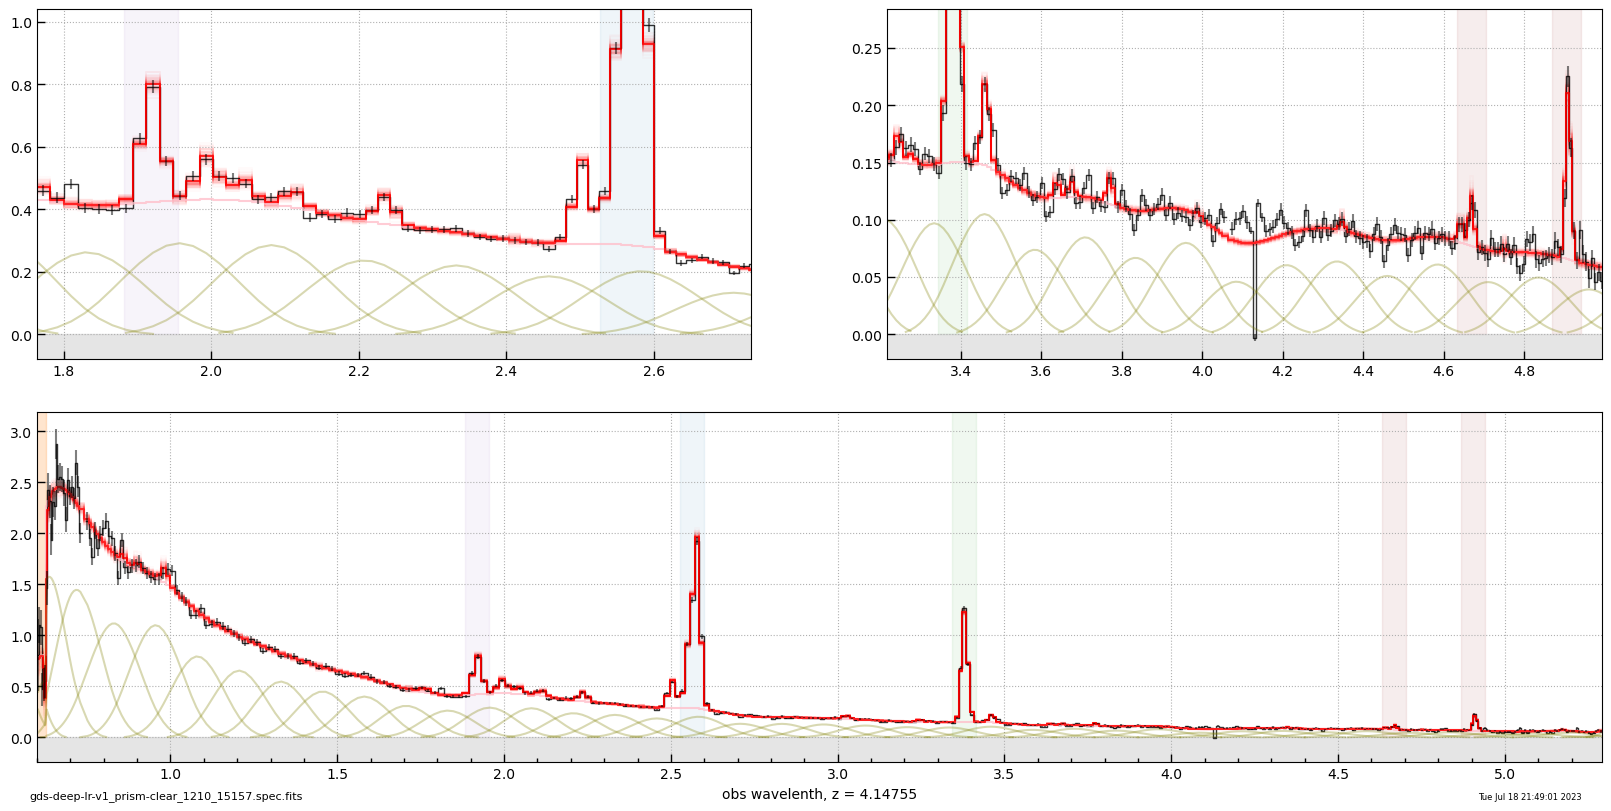
for url in urls:
    if 'prism' in url:
        break

_file = os.path.basename(url)
if not os.path.exists(_file):
    ! wget {url}
import astropy.units
_ = msaexp.spectrum.plot_spectrum(url, z=z, plot_unit=astropy.units.microJansky)
# line flux err
# flux x 10^-20 erg/s/cm2
# https://s3.amazonaws.com/msaexp-nirspec/extractions/gds-deep-lr-v1/gds-deep-lr-v1_prism-clear_1210_15157.spec.fits
# z = 4.14871
# Tue Jul 18 21:48:58 2023
             line Hb       76.2 ±      3.7
             line Hg       26.2 ±      6.1
             line Hd       18.2 ±      4.9
         line Ha+NII      263.0 ±      4.2
     line NeIII-3968       26.3 ±      5.7
      line OIII-4959      185.4 ±      5.8
      line OIII-5007      452.2 ±      8.6
      line OIII-4363        1.2 ±      5.8
            line OII      131.9 ±      7.2
      line HeII-4687       -1.5 ±      3.1
     line NeIII-3867       40.2 ±     10.1
       line HeI-3889       12.5 ±      9.5
            line SII       19.7 ±      1.4
       line OII-7325        5.2 ±      1.1
     line ArIII-7138        3.3 ±      1.0
     line ArIII-7753        1.4 ±      0.9
      line SIII-9068        6.9 ±      1.0
      line SIII-9531       20.0 ±      1.5
        line OI-6302        6.1 ±      1.8
            line PaD        2.3 ±      1.1
            line Pa8        7.4 ±      1.4
            line Pa9       -0.3 ±      1.0
           line Pa10        3.6 ±      1.0
       line HeI-5877        8.1 ±      1.7
      line OIII-1663       10.1 ±     12.8
      line CIII-1908       47.5 ±     13.7
      line NIII-1750       17.6 ±     13.1
            line Lya     -107.9 ±     22.9
           line MgII       -7.3 ±      9.2
       line NeV-3346        5.8 ±      6.8
      line NeVI-3426       18.0 ±      6.9
       line HeI-7065        2.9 ±      1.0
       line HeI-8446        0.8 ±      0.9
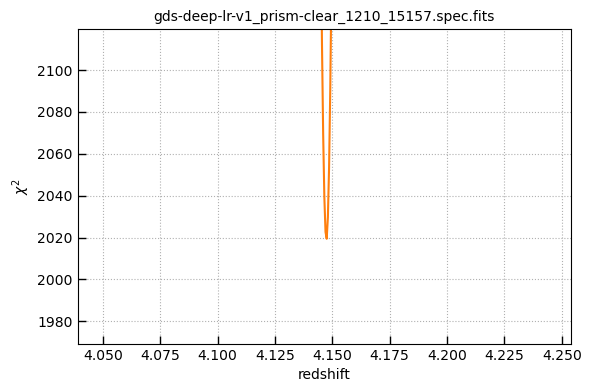
# Fit redshift
_ = msaexp.spectrum.fit_redshift(_file, z0=[z-0.1, z+0.1])
20it [00:00, 88.12it/s]
101it [00:01, 89.43it/s]


# line flux err
# flux x 10^-20 erg/s/cm2
# gds-deep-lr-v1_prism-clear_1210_15157.spec.fits
# z = 4.14755
# Tue Jul 18 21:49:01 2023
             line Hb       76.9 ±      3.9
             line Hg       27.2 ±      6.3
             line Hd       17.0 ±      5.8
         line Ha+NII      265.8 ±      4.2
     line NeIII-3968       22.9 ±      6.3
      line OIII-4959      174.2 ±      5.9
      line OIII-5007      457.3 ±      8.8
      line OIII-4363        2.2 ±      5.9
            line OII      132.0 ±      7.7
      line HeII-4687       -0.1 ±      3.2
     line NeIII-3867       37.7 ±     10.5
       line HeI-3889       11.9 ±      9.7
            line SII       17.4 ±      1.5
       line OII-7325        4.9 ±      1.1
     line ArIII-7138        2.7 ±      1.1
     line ArIII-7753        0.7 ±      1.0
      line SIII-9068        7.0 ±      1.0
      line SIII-9531       16.5 ±      1.5
        line OI-6302        7.6 ±      1.9
            line PaD        1.6 ±      1.2
            line Pa8       10.8 ±      1.4
            line Pa9        0.5 ±      1.0
           line Pa10        3.1 ±      1.0
       line HeI-5877        8.4 ±      1.8
      line OIII-1663       12.4 ±     13.7
      line CIII-1908       35.9 ±     14.6
      line NIII-1750       11.6 ±     13.8
            line Lya     -104.6 ±     24.1
           line MgII       -0.2 ±     10.7
       line NeV-3346        3.2 ±      8.5
      line NeVI-3426       17.5 ±      7.4
       line HeI-7065        3.0 ±      1.1
       line HeI-8446        1.3 ±      1.0
TBD
Items under development:
- Scale spectrum to photometry
- Fit for emission line widths