Gabriel Brammer
(This page is auto-generated from the Jupyter notebook nirspec-extractions-v2.ipynb.)
We have reprocessed all of the public NIRSpec datasets from the earlier DJA release with the latest jwst pipeline and calibration files and updated msaexp v0.7 release.
Some of the major differences with respect to the previous reductions are as follows:
- Improved initial Level1 processing with snowballs identified and masked in individual exposure groups using the snowblind module. The
uncal.fitsfiles are downloaded from MAST and processed automatically with grizli.aws.recalibrate.do_recalibrate. - The 2D extraction and rectification is handled in msaexp.slit_combine. The main algorithmic difference of the
v2extractions is that the background is removed by taking differences of the original 2D slitlet cutouts before drizzle resampling, i.e., differences between the cross-dispersion nods. - Then the final spectra are combined with a 2D weighted nearest-neighbor resampling to rectify them along rows of the 2D array, but where all wavelength bins are fully independent, i.e., no correlated noise from drizzling.
- The 2D profile for the optimal extraction is also determined along the curved traces of the original spectral cutouts and rebinned/rectified in the same way as the data. The final 1D spectrum is the optimal extraction using this profile.
msaexpnow has its own path loss correction that uses the width of the fitted profile along with the predicted intra-shutter position. The final spectra tend to lie much closer to the scale set by the photometry than the previous versions, though for many applications you’d probably still want to scale to whatever photometry yourself.- For programs that obtain spectra of a particular source with multiple dispersers (e.g., prism and gratings), the centering and source width of the optimal extraction profile is determined from the spectrum with the highest median S/N (usually the prism) and extractions in the other gratings are forced with those profile parameters.
Data release
The compilation of extracted spectra and redshift measurements is provided at nirspec_graded_v2.html.
The redshift quality grades have been copied from those of the previous release where the redshift measurements themselves agree to within tight tolerances, and extractions from any new programs since the first release were visually inspected and graded.
Note
The v2 spectra are affected by a bug that causes the uncertainties in the derived products to be too large by roughly a factor of f = N^{1/4}, where N is the number of combined exposures grouped by source_name / detector / grating / filter / MSA plan. For a simple set of three exposures with the 3-Shutter-Nod dither pattern, f = 3^{1/4} ~ 1.3, i.e., the tabulated uncertainties are roughly 1.3× too large. The effect of the bug is larger for deeper programs; for typical UNCOVER extractions f = 18^{1/4} ~ 2. For more information, see msaexp PR#54.
Observing programs
| Program | DJA root | N | Grating |
|---|---|---|---|
| 2756 | abell2744-ddt-v2 | 118 | PRISM-CLEAR |
| 1810 | bluejay-north-v2 | 519 | G140M-F100LP |
| bluejay-south-v2 | G235M-F170LP | ||
| G395M-F290LP | |||
| 1747 | borg-0314m6712-v2 | 205 | PRISM-CLEAR |
| borg-0859p4114-v2 | |||
| borg-1033p5051-v2 | |||
| borg-1437p5044-v2 | |||
| borg-2203p1851-v2 | |||
| 2750 | ceers-ddt-v2 | 251 | PRISM-CLEAR |
| 1345 | ceers-v2 | 2236 | G140M-F100LP |
| G235M-F170LP | |||
| G395M-F290LP | |||
| PRISM-CLEAR | |||
| 1871 | gdn-chisholm-v2 | 44 | G235H-F170LP |
| G395H-F290LP | |||
| 2198 | gds-barrufet-s156-v2 | 137 | PRISM-CLEAR |
| gds-barrufet-s67-v2 | |||
| 1210 | gds-deep-v2 | 1219 | G140M-F070LP |
| G235M-F170LP | |||
| G395H-F290LP | |||
| G395M-F290LP | |||
| PRISM-CLEAR | |||
| 6541 | gds-egami-ddt-v2 | 345 | PRISM-CLEAR |
| 3215 | gds-udeep-v2 | 821 | G140M-F070LP |
| G395M-F290LP | |||
| PRISM-CLEAR | |||
| 2565 | glazebrook-cos-obs2-v2 | 466 | PRISM-CLEAR |
| glazebrook-cos-obs3-v2 | |||
| glazebrook-v2 | |||
| 1211 | goodsn-wide-v2 | 186 | PRISM-CLEAR |
| 1181 | jades-gdn2-v2 | 4176 | G140M-F070LP |
| jades-gdn-v2 | G235M-F170LP | ||
| G395H-F290LP | |||
| G395M-F290LP | |||
| PRISM-CLEAR | |||
| 1286 | jades-gds1-v2 | 916 | G140M-F070LP |
| G235M-F170LP | |||
| G395H-F290LP | |||
| G395M-F290LP | |||
| PRISM-CLEAR | |||
| 1180 | jades-gds-wide2-v2 | 4779 | G140M-F070LP |
| jades-gds-wide-v2 | G235M-F170LP | ||
| G395M-F290LP | |||
| PRISM-CLEAR | |||
| 4246 | macsj0647-hr-v2 | 44 | G395H-F290LP |
| 1433 | macsj0647-v2 | 140 | PRISM-CLEAR |
| 4557 | pearls-transients-v2 | 210 | PRISM-CLEAR |
| 4233 | rubies-uds1-v2 | 1480 | G395M-F290LP |
| rubies-uds2-v2 | PRISM-CLEAR | ||
| rubies-uds3-v2 | |||
| 2767 | rxj2129-ddt-v2 | 241 | G140M-F070LP |
| G140M-F100LP | |||
| PRISM-CLEAR | |||
| 2736 | smacs0723-ero-v2 | 102 | G235M-F170LP |
| G395M-F290LP | |||
| 4446 | snh0pe-v2 | 116 | G140M-F100LP |
| G235M-F170LP | |||
| PRISM-CLEAR | |||
| 2110 | suspense-kriek-v2 | 45 | G140M-F100LP |
| 2561 | uncover-v2 | 766 | PRISM-CLEAR |
import os
if os.path.exists('gbrammer' in os.environ['HOME']) & False:

    # Extract summary from database
    from grizli.aws import db
    import pyperclip

    # db queries require DB credentials
    nre = db.SQL("""select SUBSTR(MIN(dataset), 4, 4) as pid,
                           array_agg(DISTINCT(root)) as root,
                           count(*) as N,
                           array_agg(DISTINCT(grating || '-' || filter)) as Grating
    FROM nirspec_extractions WHERE ROOT LIKE '%%v2' AND dataset not like 'jw01208%%'
    GROUP BY SUBSTR(dataset, 4, 4)
    ORDER BY MAX(root)""")

    nre['root'] = ['\n'.join(r) for r in nre['root']]
    nre['grating'] = ['\n'.join(r) for r in nre['grating']]
    nre.rename_column('root','DJA root')
    url = '[{pid}](https://www.stsci.edu/cgi-bin/get-proposal-info?id={pid}&observatory=JWST)'
    prog = [url.format(**row) for row in nre]
    nre['Program'] = prog

    pyperclip.copy('## Observing programs\n\n' +
                   nre['Program','DJA root','n','grating'].to_pandas(index=False).to_markdown(index=False))
%matplotlib inline

import os
import yaml

import numpy as np
import matplotlib.pyplot as plt

import warnings
warnings.filterwarnings('ignore')

import astropy.io.fits as pyfits

import grizli
import grizli.catalog
from grizli import utils

import eazy
import msaexp
import msaexp.spectrum

print(f'grizli version: {grizli.__version__}')
print(f'eazy-py version: {eazy.__version__}')
print(f'msaexp version: {msaexp.__version__}')
grizli version: 1.11.3.dev2+gd57387c.d20240222
eazy-py version: 0.6.8.dev1+g3fb0ad2.d20240129
msaexp version: 0.7.3.dev0+g3e012ec.d20240222
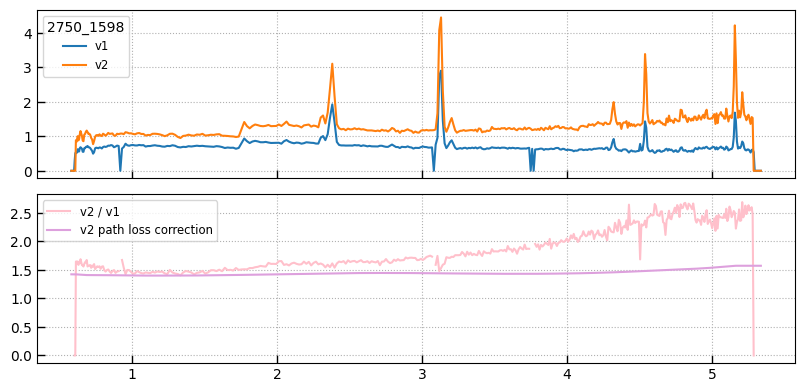
Compare v1 and v2
- The
v2extractions are generally cleaner with fewer non-Gaussian outliers - The normalization of the
v2extractions is generally both “brighter” and “redder” as a result of the internal wavelength-dependent path loss correction
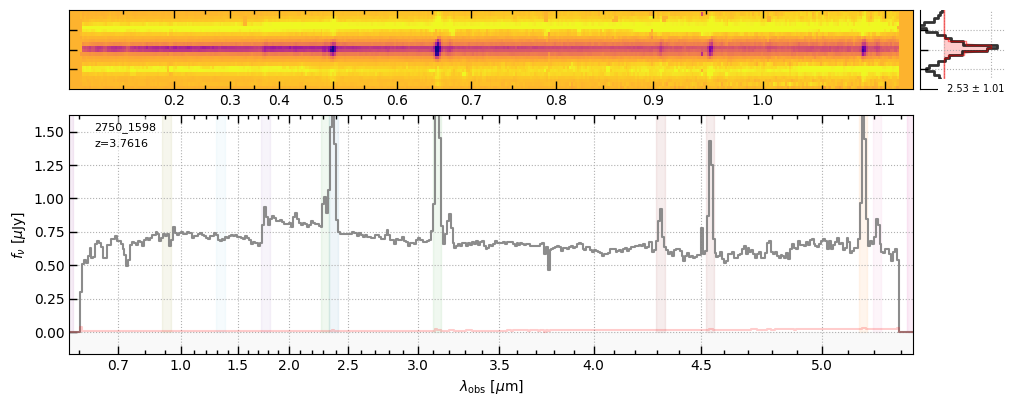
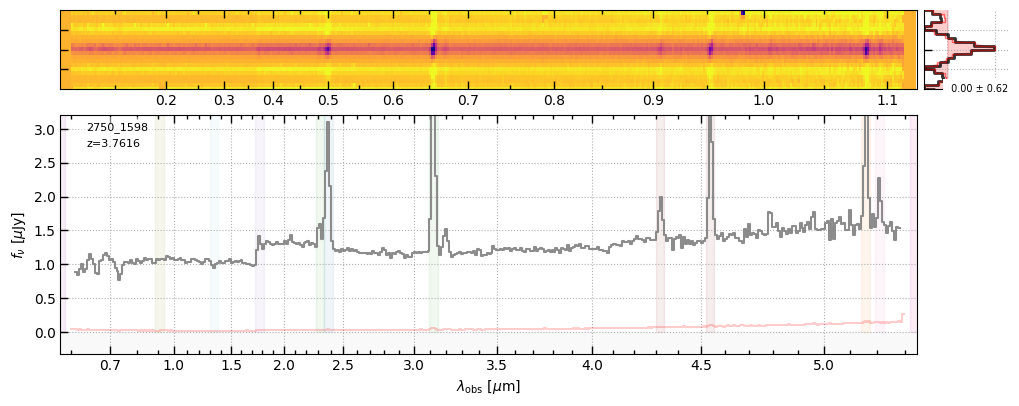
z = 3.7616
_prefix = 'https://s3.amazonaws.com/msaexp-nirspec/extractions/'
v2_file = _prefix + 'ceers-ddt-v2/ceers-ddt-v2_prism-clear_2750_1598.spec.fits'

v1_file = v2_file.replace('ceers-v2','ceers-lr-v1').replace('-v2','-v1')
print(v1_file + '\n' + v2_file)

sp1 = msaexp.spectrum.SpectrumSampler(v1_file)
sp2 = msaexp.spectrum.SpectrumSampler(v2_file)

f1 = sp1.drizzled_hdu_figure(z=z, unit='fnu')
f2 = sp2.drizzled_hdu_figure(z=z, unit='fnu')
https://s3.amazonaws.com/msaexp-nirspec/extractions/ceers-ddt-v1/ceers-ddt-v1_prism-clear_2750_1598.spec.fits
https://s3.amazonaws.com/msaexp-nirspec/extractions/ceers-ddt-v2/ceers-ddt-v2_prism-clear_2750_1598.spec.fits
import msaexp.slit_combine
from msaexp.slit_combine import slit_prf_fraction

fig, axes = plt.subplots(2,1,figsize=(8,4), sharex=True)

ax = axes[0]
ax.plot(sp1['wave'], sp1['flux'], label='v1')
ax.plot(sp2['wave'], sp2['flux'], label='v2')
leg = ax.legend(loc='upper left')
leg.set_title(sp2.meta['SRCNAME'])
ax.grid()

# Ratios
axes[1].plot(sp2['wave'], sp2['flux'] / sp1['flux'], label=r'v2 / v1', color='pink')

path_corr = slit_prf_fraction(sp2.spec['wave'].astype(float),
                              sigma=sp2.spec.meta['SIGMA'],
                              x_pos=sp2.spec.meta['SRCXPOS'],
                              slit_width=0.2,
                              pixel_scale=msaexp.slit_combine.PIX_SCALE,
                              verbose=False)

axes[1].plot(sp2.spec['wave'], 1./path_corr, color='plum', label='v2 path loss correction')
axes[1].grid()
axes[1].legend(loc='upper left')

fig.tight_layout(pad=1)
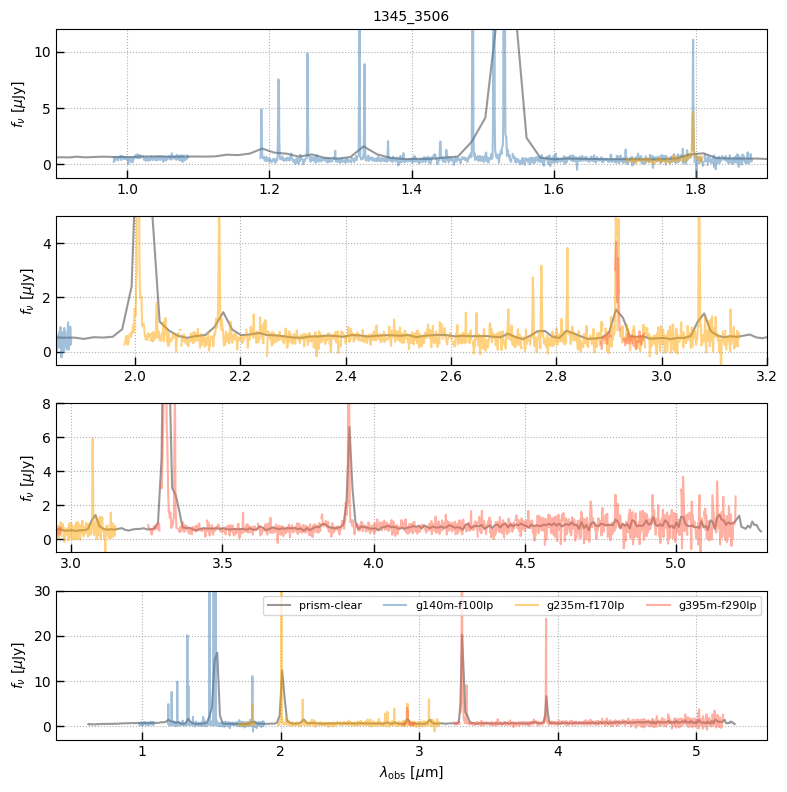
Compare gratings
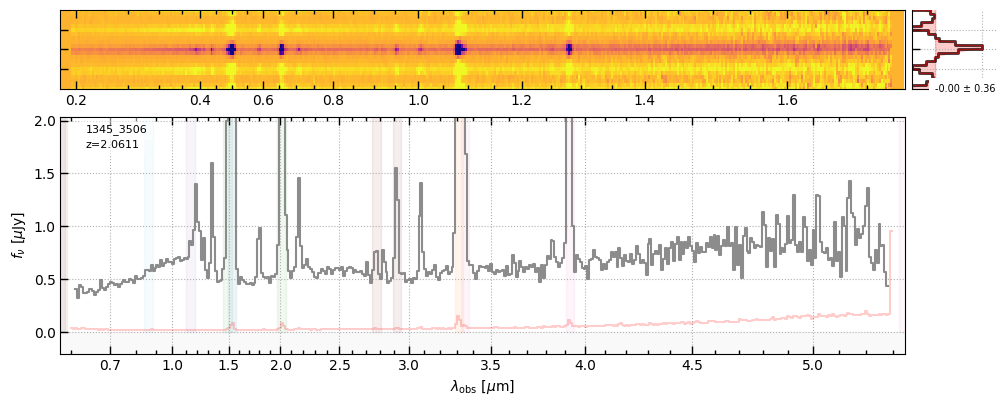
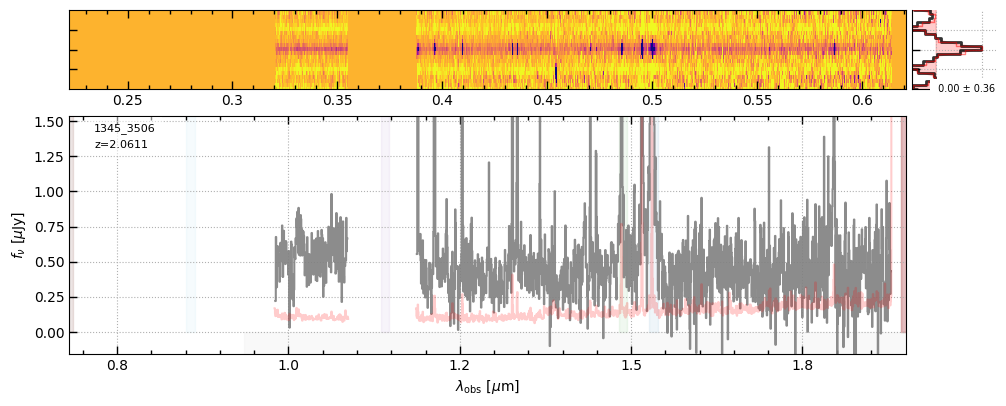
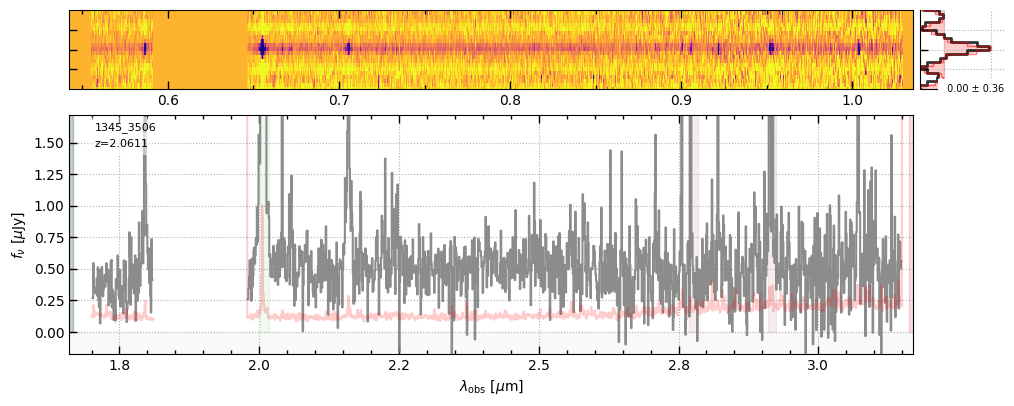
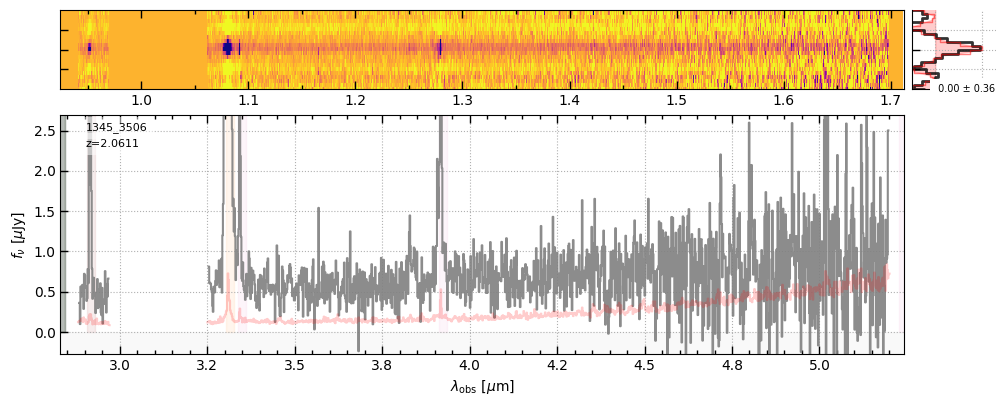
All v2 extractions with different gratings for a particular source + program now have the same root, rather than being split in some cases. For example, all of the CEERS (ERS-1345) spectra now have root = ceers-v2 where they were split between the prisms (ceers-lr-v1) and gratings (ceers-mr-v1) before.
Note: There remains an msaexp bug that causes the tick intervals on the automatic grating figures plotted below to look strange. The minor ticks are evenly spaced in 0.05µm intervals, but the labels are rounded to a single decimal place (e.g., 3.75 becomes 3.8).
z = 2.0611
_prefix = 'https://s3.amazonaws.com/msaexp-nirspec/extractions/'
prism_file = _prefix + 'ceers-v2/ceers-v2_prism-clear_1345_3506.spec.fits'

sp = {}
for grating in ['prism-clear','g140m-f100lp','g235m-f170lp','g395m-f290lp']:
    file = prism_file.replace('prism-clear',grating)
    print(file)
    sp[grating] = msaexp.spectrum.SpectrumSampler(file)

    fig = sp[grating].drizzled_hdu_figure(z=z, unit='fnu')
https://s3.amazonaws.com/msaexp-nirspec/extractions/ceers-v2/ceers-v2_prism-clear_1345_3506.spec.fits
https://s3.amazonaws.com/msaexp-nirspec/extractions/ceers-v2/ceers-v2_g140m-f100lp_1345_3506.spec.fits
https://s3.amazonaws.com/msaexp-nirspec/extractions/ceers-v2/ceers-v2_g235m-f170lp_1345_3506.spec.fits
https://s3.amazonaws.com/msaexp-nirspec/extractions/ceers-v2/ceers-v2_g395m-f290lp_1345_3506.spec.fits
fig, axes = plt.subplots(4,1,figsize=(8,8))

colors = ['0.2','steelblue','orange','tomato']

for i, grating in enumerate(sp):
    sp[grating]['flux'][~sp[grating].valid] = np.nan
    for ax in axes:
        ax.plot(sp[grating]['wave'], sp[grating]['flux'], alpha=0.5, label=grating, color=colors[i])

leg = axes[3].legend(ncol=4, fontsize=8)
axes[0].set_title(sp[grating].meta['SRCNAME'])

axes[0].set_xlim(0.9, 1.9); axes[0].set_ylim(-1.2, 12)
axes[1].set_xlim(1.85, 3.2); axes[1].set_ylim(-0.5, 5)
axes[2].set_xlim(2.95, 5.3); axes[2].set_ylim(-0.8, 8)
axes[3].set_ylim(-3,30)
axes[3].set_xlabel(r'$\lambda_\mathrm{obs}~[\mu\mathrm{m}]$')

for ax in axes:
    ax.grid()
    ax.set_ylabel(r'$f_\nu~[\mu\mathrm{Jy}]$')

fig.tight_layout(pad=1)